
Wen Yi Zou Jingxian (Associate Professor, National Institute of Development and Strategy, Renmin University of China, China Macroeconomic Forum (CMF) main members )
The article is based on the author’s representativeCMFThe speeches made when the forum released the report were compiled without the author’s confirmation.
"V-like" means a little like V-like, but not all. The part circled in red is the overall performance of the zero year-on-year growth rate of the society this year, and the blue and yellow lines are the nominal and actual growth rates respectively. For example, V-type refers to this part. From March to July, the year-on-year growth rate was in a negative range, and the lowest point appeared in April. At that time, the nominal and actual growth rates were -11% and -14% respectively, and then it rebounded.
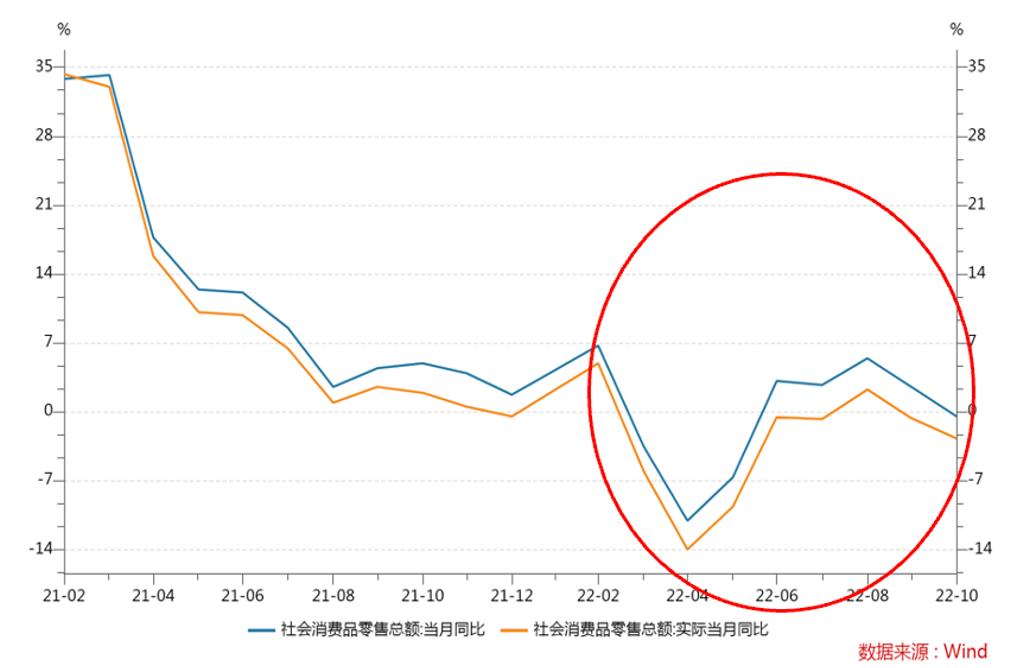
If the data stays in August, it can be said that consumption has gone out of a very typical V-shape, but this is not the case. After August, it turned down, and the actual growth rate fell to a negative range in September. In October, the nominal actually turned negative, nominally -0.5%, but actually -2.74%.
This is a year-round "V-like".
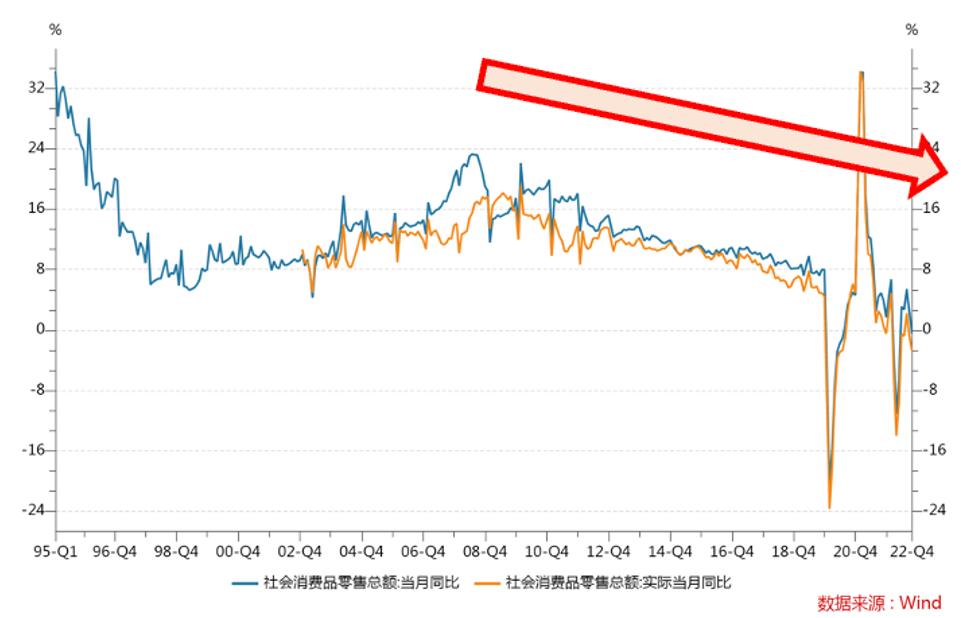
As a whole, it is at a low level, no matter compared with the data in 2021. If we look at it in a longer period of time, from 1995, when there is data, the current data continues the overall downward trend in 2008.
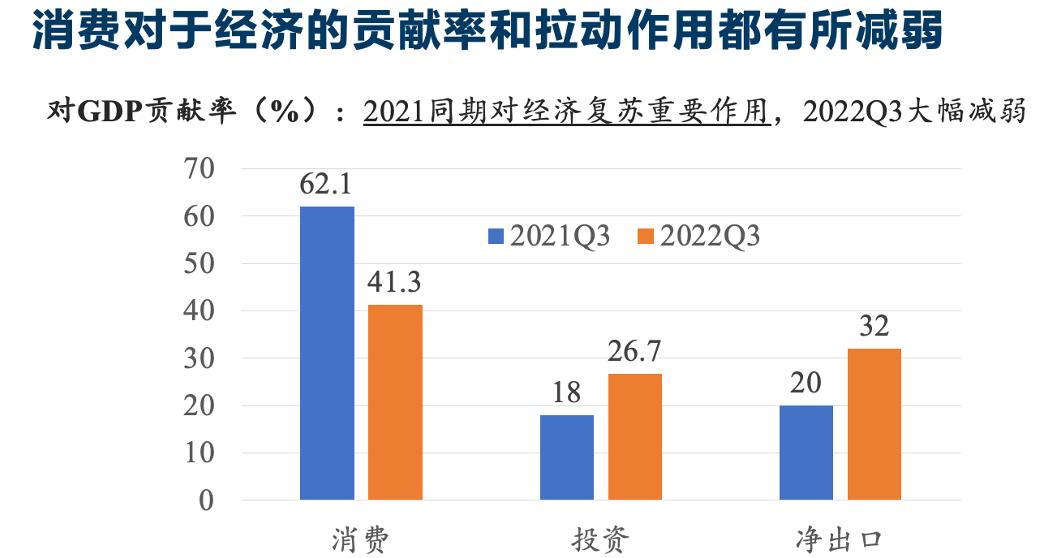
The natural result of weak consumption is a decline in the contribution rate and pulling effect on the economy. Orange is the contribution rate of the three major demands to GDP in the first three quarters of this year, and blue is the contribution rate of demand to GDP in the first three quarters of 2021 in the same period last year. In the same period last year, the contribution rate of consumption to GDP was as high as 62%, and consumption played a very important role in last year’s economic recovery. However, the contribution rate of consumption to GDP has dropped sharply to 41% this year, and accordingly, the contribution rates of investment and import and export to GDP are going up.
Which consumption is good and which consumption is not good? First of all, it is divided into food and non-food categories, and look at Engel coefficient. Then we look at the eight categories of consumer goods of the Bureau of Statistics, and finally look at the industry.
Food consumption accounts for the proportion of all consumption, and blue and orange are Engel’s coefficients of urban and rural residents respectively. Before the epidemic, Engel’s coefficient showed a downward trend in both towns and rural areas, which was in line with economic theory-the proportion of food in consumption expenditure would gradually decrease with the increase of income level in both individuals and countries, but the epidemic disrupted this trend.
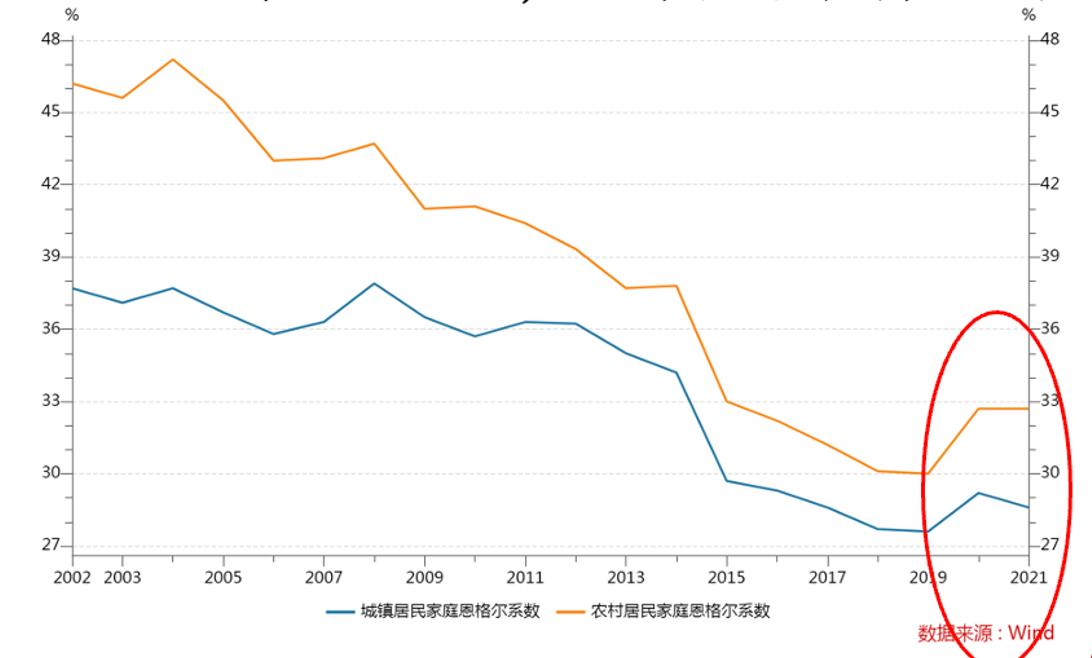
After the outbreak, Engel’s coefficient in both urban and rural areas increased significantly, from 27.6% to 29.2% in urban areas and from 30% to 32% in rural areas, basically returning to the level around 2016. The latest data in 2021 shows that the Engel coefficient of cities and towns has dropped slightly, but it is still higher than before the epidemic; Rural areas are the same as in 2020.
Why should we discuss Engel’s coefficient first? Because this indicator is often used to observe whether consumption is upgraded or downgraded, this leads to a discussion: Is there an overall consumption downgrade in China due to the slowdown in growth and income after the epidemic? To answer this question, if we think that income is the main factor, then if we put the provinces together, the horizontal axis is the change of per capita GDP and the vertical axis is the change of Engel coefficient. Theoretically, there should be a significant negative correlation, that is, the income grows faster and the Engel coefficient decreases faster. But the result is not, on the contrary, a strong positive correlation coefficient, that is to say, when explaining the rise of Engel coefficient, the explanatory power of income is not so strong. If we look at 2019 -2020, although the Engel’s coefficient is rising in most provinces, there are still two provinces where the Engel’s coefficient has declined, namely Guizhou and Qinghai. Obviously, the decline of Engel’s coefficient in these two provinces is difficult to be explained by their higher income growth.
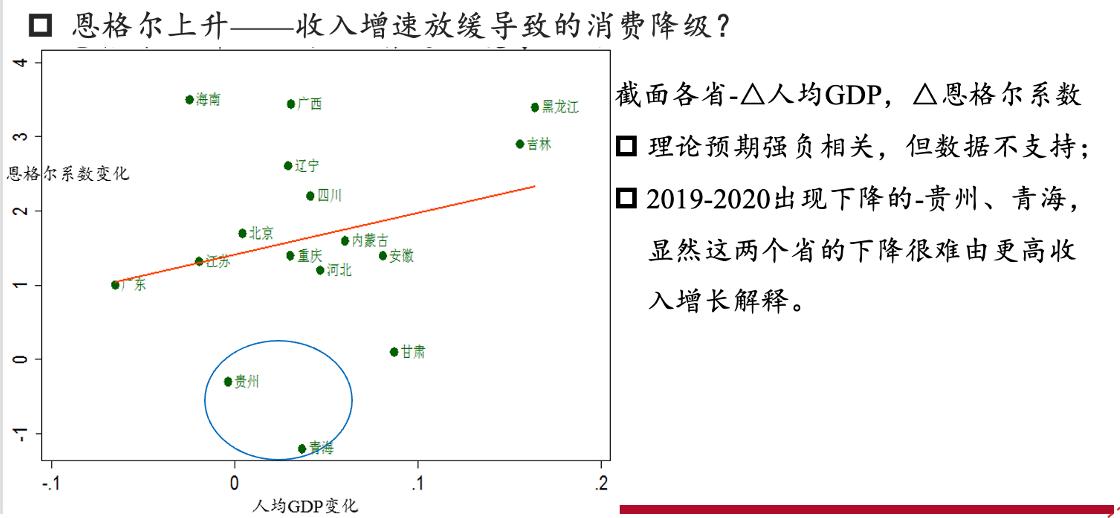
These two sets of evidence show that although the Engel coefficient has increased after the epidemic, income is certainly not the whole story. If income is not the main explanation, what is the main reason? First, the rise in food prices in the short term. Second, the epidemic has limited the consumption scene, which is related to the control policy. You can imagine an extreme example, for example, you are locked in a building, and most of your short-term expenditure is food. Therefore, we can’t simply use the rise of Engel’s coefficient to explain that China is experiencing an obvious consumption downgrade.
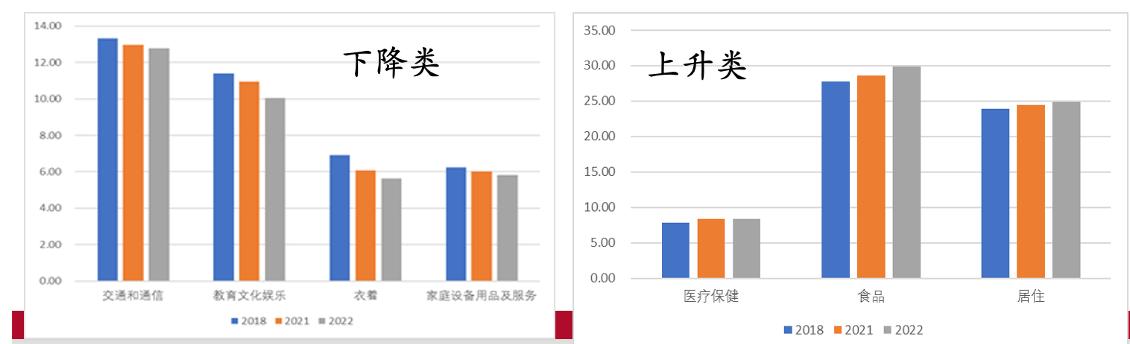
After talking about Engel’s coefficient, let’s look at the eight categories of consumer goods of the Bureau of Statistics, because we are not sure what the "other categories" are, and we will focus on comparing the remaining seven categories. See the figure below. The gray bar chart is the data of the first three quarters of this year, blue is the data of 2018 before the epidemic, and orange is the data of 2021. There are four main categories for the decline in consumption: transportation and communication, education, culture and entertainment, clothing, household equipment and services. In these four categories, transportation, communication, education, culture and entertainment, and clothing are all directly related to the limited consumption scene and the narrowing of social radius. This home equipment and service is mainly related to the decline of real estate. What’s up? There are three categories, one is medical care, and food, which is consistent with the increase of Engel’s coefficient, in addition to housing.
On the basis of eight categories of consumption, it is subdivided into industries. There are two major categories of industries that are dragged down. One category is high-contact industries, including entertainment, catering and accommodation, wholesale and retail, and transportation and aviation. Take the typical catering as an example. Generally speaking, the catering performance on holidays such as "Golden September, Silver 10" and National Day is generally good, but we see that the year-on-year consumption in September was -1.7%, and it further dropped to -8.1% in October. The second category is mainly related to real estate, including furniture, building and decoration materials, household appliances and audio equipment. Take furniture as an example, the average growth rate in the first nine months of this year was -8.6%, and there was a positive growth rate of 16% last year.
Current situation of consumption: summary
On the whole, the whole year is "V-like", a bit like V-shaped, but the foundation of the recovery part is unstable and historically at a low level.
From a structural perspective, Engel’s coefficient tells us that the proportion of food consumption has risen sharply after the epidemic, but behind this is not only the income factor, but also the short-term increase in food prices and the limited consumption scenarios related to epidemic prevention policies.
Eight categories of consumer goods and sub-sectors tell us that the decline is related to high contact and real estate, while the rise is related to medical accommodation.
Macro-level perspective: consumption ability and willingness ("can" and "willing")
The most important thing in spending power must be income. There are two points in income. First, the growth rate of residents’ income slowed down after the epidemic and continued to be lower than the GDP growth rate. First, let’s look at the absolute level of income growth. The piece circled in the following figure is the performance after the epidemic. The per capita disposable income of urban residents was still 5.9% in the first quarter of 2019, and fell to -2% in the second quarter of 2020. After that, it rebounded, but it turned sharply again after 2021. There was a slight rebound in the third quarter of 2022, but the overall situation was still at a historical low.
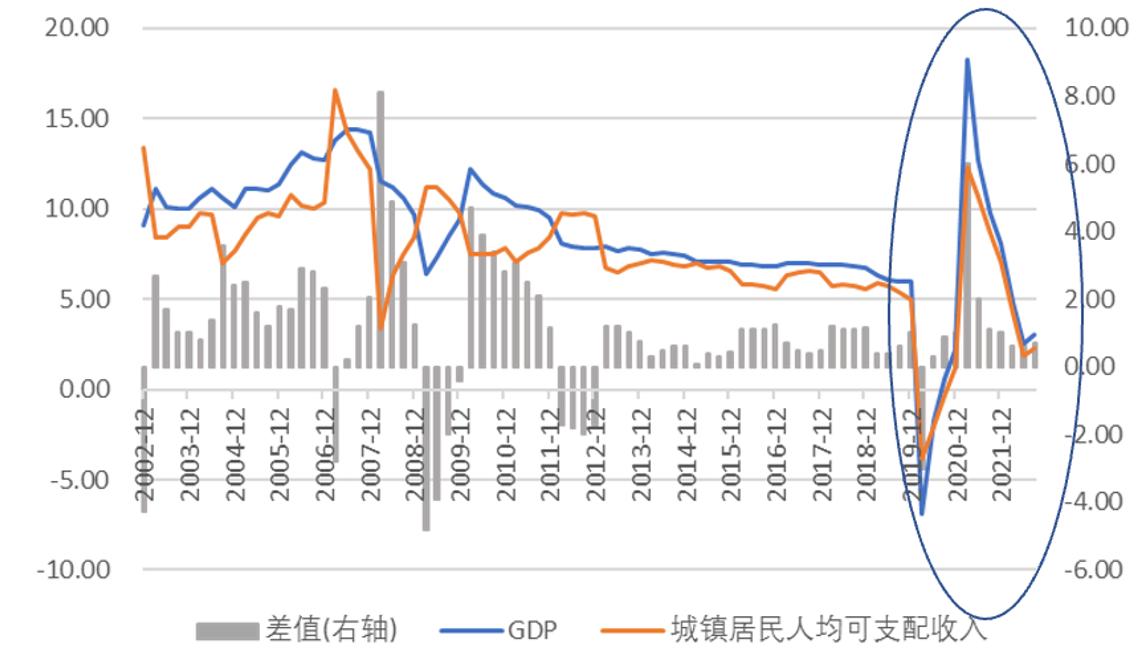
Compared with the absolute level of income, we should also look at its relative level, that is, the growth rate relative to GDP. The blue line is GDP growth rate, orange is the change of per capita disposable income of urban residents, and the gray histogram is the change of GDP minus per capita disposable income growth rate. After 2013, except for the month of March 2020, the growth rate of residents’ income continues to be lower than the growth rate of GDP, which will form a particularly bad vicious circle when the economy is not very good. How does the cycle happen? Under the background of low growth, the income growth is even lower, which leads to weak expectations and consumption of residents, thus further strengthening the story of low growth.
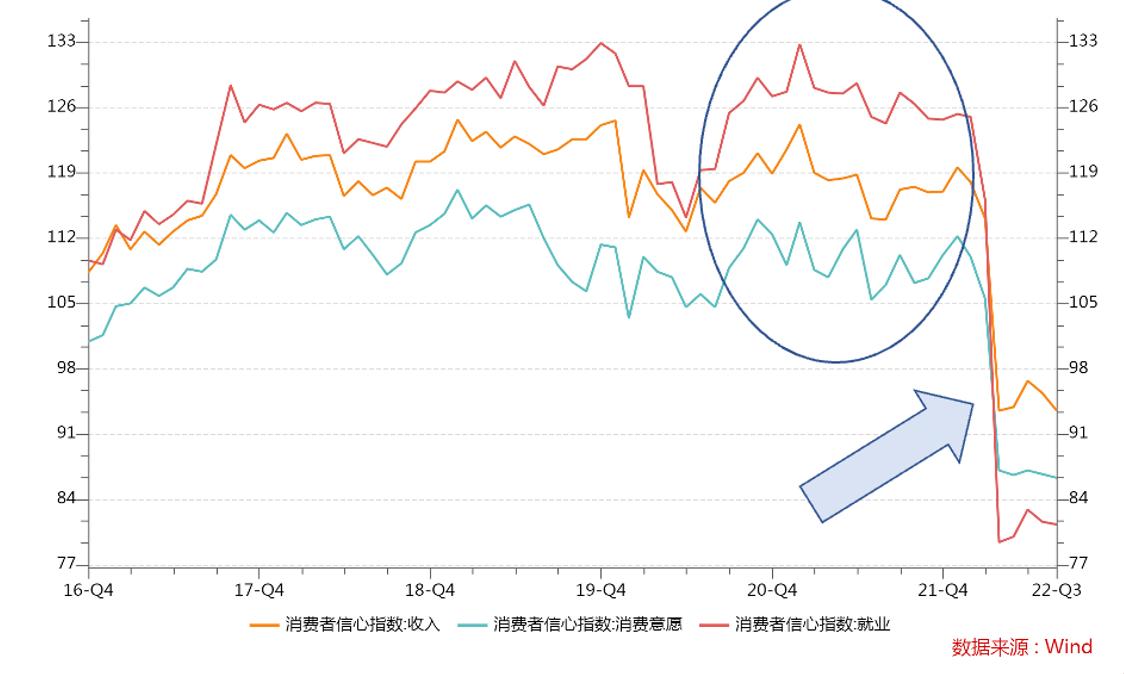
"Can you spend" is related to the limited consumption scene and the shrinking social radius. "Willing or not" mainly depends on the confidence of consumers. The weakness of consumption is related to the weak expectations of residents, especially those related to employment.
The three lines below are consumer confidence indexes of income, willingness to consume and employment. It can be seen that after the epidemic, for a period of time, from 2020 to the first quarter of this year, the overall consumer confidence was still at a high level, and there was no significant difference from before the epidemic. However, from the end of the first quarter of this year, residents’ confidence began to plummet, with the biggest decline being the red line, that is, consumers’ confidence in employment dropped sharply from 116% in March to 79% in April.
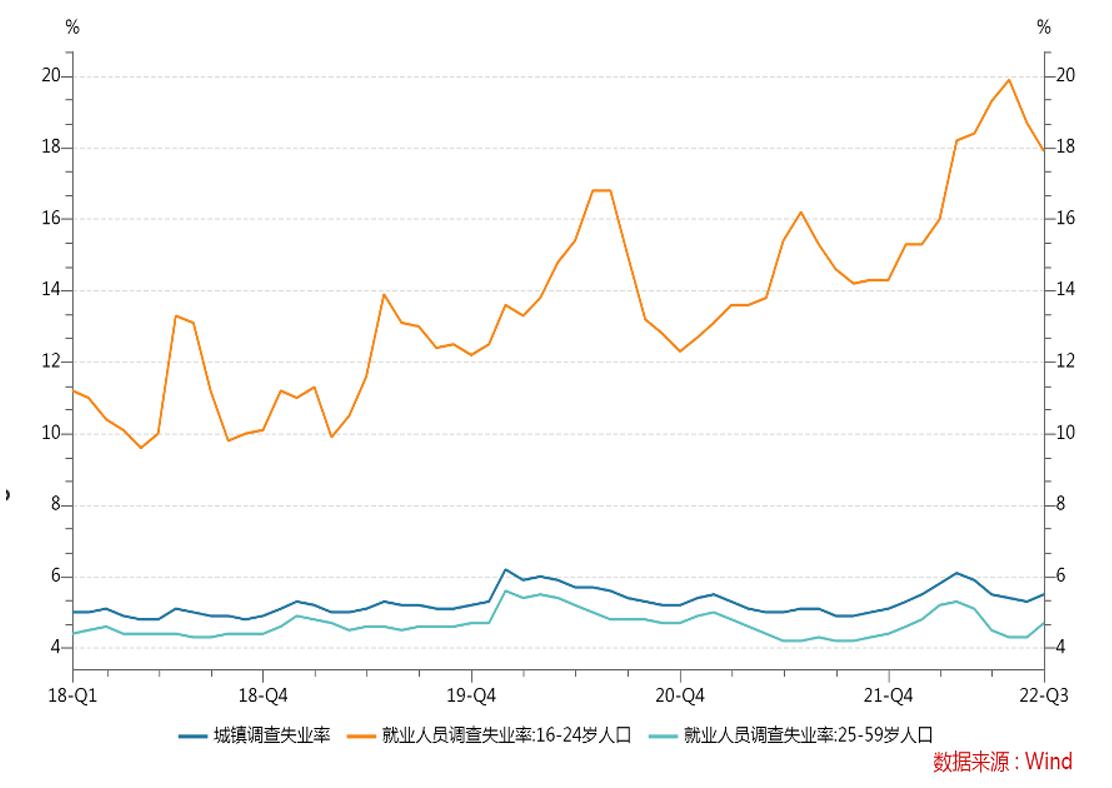
Consumers’ confidence in income and employment is also very consistent with the overall situation of the job market. What is shown here is the unemployment rate of all ages. The high unemployment rate of young people (16 -24 years old) has been discussed a lot. After reaching a peak of nearly 20% in July, it has been adjusted back, but it is still in a high position.
Micro (household) perspective
We use some household data to find that the current slowdown in income growth is reflected in multi-source income. Among them, wage income and property income together account for more than 70% in per capita disposable income.
Look first.Property income, if you invest in the stock market, the stock market keeps falling, financial management frequently explodes, and the bond market has plummeted recently. It can be said that it is not easy to invest in financial management to protect the capital this year.
Property income is of special significance to the current weak consumption. Teacher Wang Xianghong of Renmin University of China and others, based on the findings of micro-household data, divide income into property income, transfer income, operational income and wage income. First, look at the marginal propensity to consume of different types of income; Second, what kind of consumption is the income mainly used for? They found that the highest marginal propensity to consume is property income, and it is mainly used for transportation, communication, culture, education and entertainment, which have high demand elasticity. The lowest marginal propensity to consume is wage income, which is mainly used for living. This result is very intuitive. For example, if I earn 100 yuan from the stock market today, it is a windfall to some extent, and it is very likely that I will use most of it for entertainment. However, wage income is the most reliable and stable part of my income, and I may use it to pay rent and mortgage. Looking back just now, the worst consumption this year is transportation, communication, culture, education and entertainment. In this sense, property income is also of great significance for stimulating this part of consumption, which is a micro-level evidence.
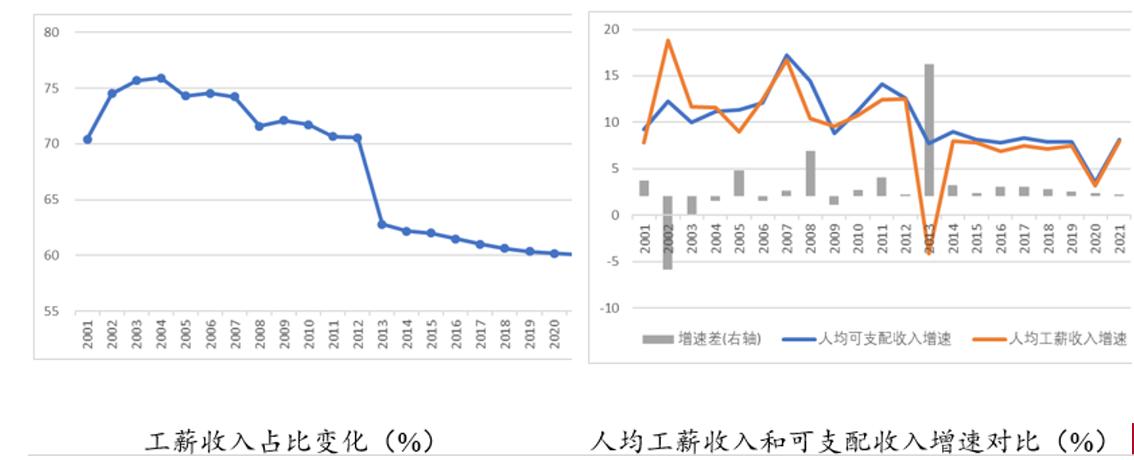
Look at wage income. We borrow a word "ballast stone", and wage income can be said to be the "ballast stone" in disposable income of urban households, accounting for more than 60% all the year round. The performance of this "ballast stone" this year is that there are both near worries and long-term concerns. Short-term worry refers to the current severe employment situation, while long-term worry refers to the fact that in the long run, we find that wage income is becoming more and more unbearable in Yue Shi, and we can’t run.
Let’s look at the proportion of wage income in per capita disposable income: in the long run, it has been declining after experiencing the peak in 2004 (accounting for 76%), and the latest data is about 60%. This "ballast stone" is getting harder and harder to hold down. There is still no running. Blue is the overall growth rate of per capita disposable income, orange is the growth rate of wage income, and gray is the difference between them. It can be seen that after 2010, the growth rate of wage income continues to be lower than that of per capita disposable income. As mentioned earlier, the per capita disposable income is further lower than the GDP growth rate, and the ballast stone of wage income can neither be suppressed nor run, which is a big problem.
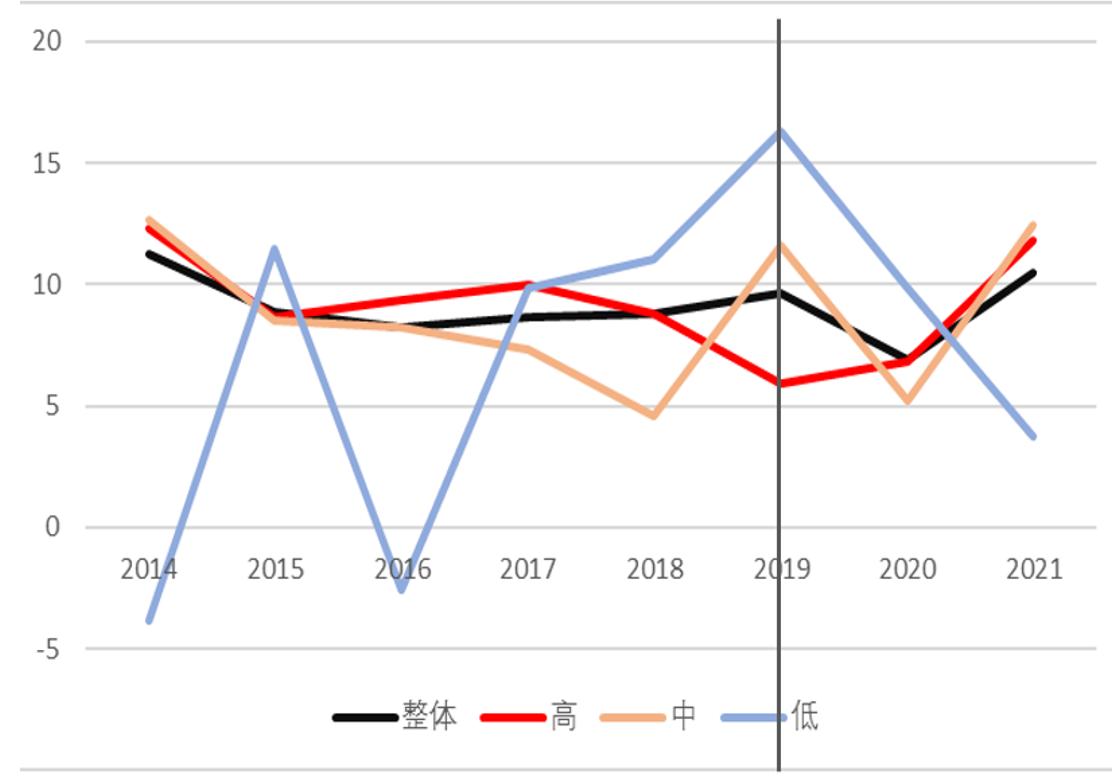
In addition to the slowdown in the growth rate of different sources, there is also a big problem of the deterioration of income distribution, and the epidemic has a greater impact on low-income groups. Considering that the marginal propensity to consume of low-income groups is higher, the deterioration of income distribution as a whole will further curb consumption. The epidemic has a greater impact on low-income groups, which is true for both towns and rural areas, but the specific performance is different. To illustrate this point, we examine the growth rate of per capita disposable income of the top 20%, middle 20% and bottom 20% income households in urban and rural areas respectively, which is an annual data.
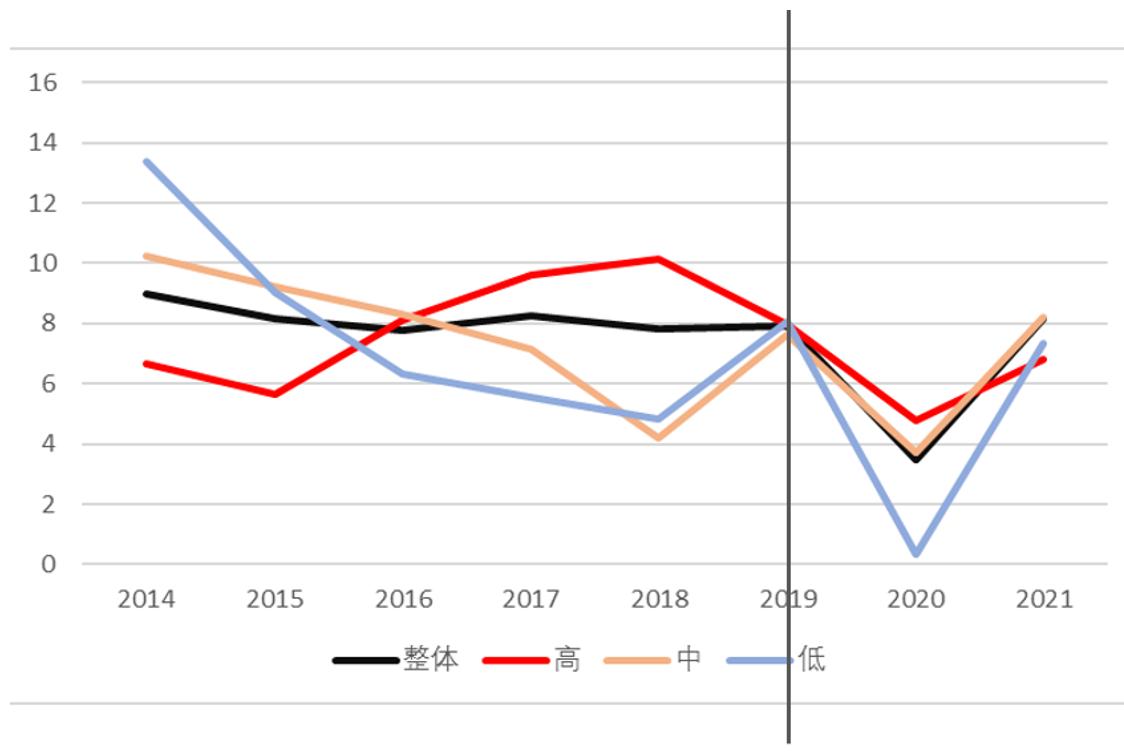
Look at the town first. Here, the black line is the growth rate of urban overall income, the red line is the growth rate of the highest 20% income households, the blue line is the growth rate of the lowest 20% income households, and the yellow line is the growth rate of the middle 20% income households. The epidemic occurred in 2019. In that year, the income growth rate of the three groups was very close, and the lowest group was slightly higher than the other two groups, with the lowest group being 8.08% and the remaining two groups being 7.98% and 7.61% respectively. However, after the outbreak, the situation changed greatly in 2020. The growth rate of the low-income group quickly dropped to near zero, with a drop of nearly 8 percentage points, compared with the drop of less than 4 percentage points in the middle and high-income groups, which showed that when the economy was negatively impacted, the resilience of different income family groups was completely different. The latest data in 2021 shows that although the low-income group has rebounded, it is still lower than the overall income growth rate.
Look at the countryside again. The form of rural performance is different. The biggest problem is that the changing trend of the low-income group is not optimistic. It can be seen that it has plummeted after the outbreak and has not been reversed yet. In contrast, the growth rate of middle and high income groups has picked up since 2020.
After talking about the growth rate, look at the comparison of absolute income levels. The indicator we use to examine the income gap is the income of the top 20% income households divided by the lowest 20% income households. The yellow ones are rural areas, and the blue ones are urban areas. After the epidemic, the income gap between urban areas and rural areas is widening, especially in rural areas, from 8.5% before the epidemic to 8.9%. Another point is that the epidemic has interrupted the general trend of improving rural income distribution since 2016.
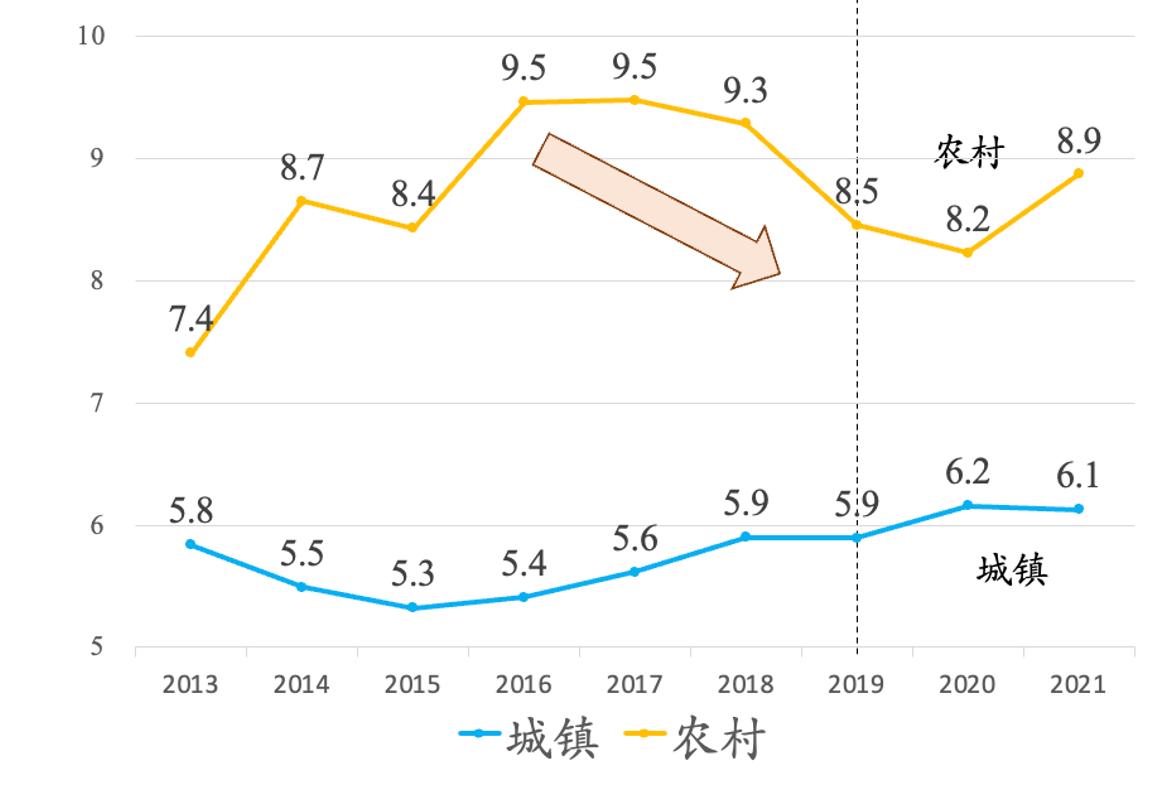
Next question, why does this epidemic have a greater impact on low-income groups? One question related to this problem is, how is it different from the economic recession we have encountered in the past? What’s different this time?
1. Industry shock. In the past, when the economy was in recession, the manufacturing industry was often the first to be hit, because the manufacturing industry was more cyclical. But this epidemic is different, it mainly impacts the service industry, and it is a high-contact service industry. A large number of low-skilled and low-income groups have gathered in this kind of high-contact service industry.
2. The COVID-19 epidemic has dual attributes. Different from previous pandemics, such as the Black Death, disasters, smallpox, SARS and H1N1 flu, the epidemic situation in COVID-19 is not only a health crisis but also an economic recession, both of which will promote automation, and this process will have a greater impact on low-income groups. It is easy to understand that epidemic disease promotes automation. If there is less contact, machines will replace people. Economic recession has dealt a greater blow to low-skilled and low-income groups. Every major economic recession will become a very important soil for technological progress in hindsight. For example, after the Great Depression in the United States, the application of assembly lines at that time was greatly promoted. During the epidemic, home office was promoted on a large scale, and it is undoubtedly more difficult for low-income groups to achieve home office. A study in the United States found that in March-July 2020, the worst epidemic in the United States, the unemployment rate of people who can’t work at home is three times that of those who can work at home.
The epidemic will pass sooner or later, so it is necessary for us to distinguish between short-term and long-term problems. There is no strict definition between short-term and long-term. What it mainly says is whether this factor will end quickly as the epidemic subsides. If it can, it will be called a short-term problem. Although some of these problems are very serious at present, as long as the epidemic is gradually controlled, it can be better solved. In contrast, we need to pay more attention to some long-term problems, that is, problems that will remain for a long time even after the epidemic subsides.
The relatively short-term problem is the weak consumption caused by contact risk and short social radius. It is expected that this problem will be better solved with the more refined epidemic control and the gradual control of the epidemic. Then there is the greater impact of the popularity of home office on low-income groups.
What are the long-term problems that need the most policy attention, that is, what factors may affect consumption for a long time after the epidemic subsides? One is the problem of income and confidence, the other is the deterioration of income distribution, and the third is the withdrawal and automatic replacement of small and medium-sized enterprises. These may be irreversible processes and need the most policy attention.
1. The most important thing is to improve the accuracy of epidemic prevention and control and smooth the economic cycle. Whether contact consumption is weak or the growth rate of household consumption is slowing down, it depends on the accuracy of epidemic prevention and control policies.
2. The root of stimulating consumption lies in the improvement of income and expectations. In order to achieve this effect, a series of "work-for-relief" projects and some landmark large projects can be introduced to enhance employment and market expectations.
3. All departments should issue targeted industry policies as soon as possible. At this point, the general policy of promoting consumption is useless, and it must be targeted at the industry and targeted. For example, for entertainment, tourism, transportation and communication, and household equipment, which are the worst performers now. For the household equipment industry, whether we can promote more green household appliances and trade-in subsidies, and whether we can consider further reducing the internet tariff to promote consumption for the communication industry. These are ideas for reference.
4. Monetary policy. At present, the advantages of easing monetary policy should outweigh the disadvantages. First of all, the benefits of loose monetary policy to enterprise costs are obvious; Let’s look at the effect on the income gap. After the epidemic, a big problem in urban and rural areas is the deterioration of income distribution. My own research found that loose monetary policy is very important for narrowing the income gap, and the main channel is the effect of keeping employment under loose monetary policy, and it is mainly for groups with poor employment stability, which is a positive role in narrowing the income gap.
What are the possible disadvantages in comparison? First of all, in the area of income distribution, some documents say that loose monetary policy may also worsen income distribution, and the main mechanism is property-related channels. If monetary policy is loose, the rich may benefit more from property, but this is not supported by data. Under loose monetary policy, the rich have not been found to gain more property benefits. Second, there may be inflation, but if we look at the world now, China’s inflation is the least serious among the major economies. This is our very valuable policy space, and we should use it when it is time. Now it may be time to use it. Third, short-term realistic considerations, there may be concerns about exchange rate depreciation and capital flight, which may be valid in the short term, but I believe that in the long term, whether it is the value of RMB or the flow of international capital, China’s long-term growth expectation is more important. For example, from 2015 to 2018, when the Federal Reserve raised interest rates nine times, China’s central bank only raised interest rates three times, but there was no big fluctuation. China’s economy was fully capable of achieving a more independent monetary policy.
5. As for coupons, my idea about them is not particularly mature. What I can do is to sort out the existing findings.
The most important question is, what is the effect of coupons? We believe that the effect is quite strong, the marginal propensity to consume is roughly between 50% and 80%, and the issuance of coupons in 10 yuan can roughly boost consumption by 5-5%. Here are three groups of realistic typical cases.
First, in Singapore, in 2008, it issued a red envelope equivalent to about 9 billion yuan, which spread to everyone’s head of 1,500-2,000 yuan, and finally achieved a marginal propensity to consume of 80%. The second is the case of Hong Kong, China. In 2021, all citizens with permanent residence certificates will be given HK$ 5,000 coupons. Professor Song Zheng of the Chinese University of Hong Kong and others found that marginal propensity to consume is also at 80%. There are also studies in mainland China. Professor Gan Li of Southwestern University of Finance and Economics and other researchers found that the marginal propensity to consume is about 50% based on the coupons issued during the epidemic.
Second, how long will it take to produce results? Strong and fast, this limitation is in weeks. Take the case of Hong Kong as an example. After the first round of coupons of HK$ 2,000 were distributed, these people who got coupons increased their spending by more than HK$ 600 on average. After the second round of coupons were distributed, the consumption of the group who got the coupons increased by more than 900 Hong Kong dollars that week. On the whole, if the coupons are issued, the consumption growth can account for half of the value of coupons within one month.
Third, what is the required scale? One point of view is that it is useless to make small noises, and the scale required for China mainland is probably in the trillion level.
How? The most important question is how to raise money. In view of the tight finances of local governments, one way to consider is that the central government raises funds first and then distributes them to local governments. The distribution target should be inclined to low-and middle-income groups. The distribution channels, taking into account the advantages of digitalization in China, can be considered as large-scale e-commerce platforms such as tax declaration system and social security system including JD.COM.
After talking about the findings of the existing research, I will talk about its possible potential problems.
First, there are substitution and crowding-out effects on other consumption, which is relatively not so serious. What is more serious is that a little carelessness in the operation process will further expand the unfair phenomenon between different groups in urban and rural areas and online and offline. Take the now-popular tax declaration system as an example. This system is aimed at people whose monthly income is more than 5,000 yuan. According to Lou Jiwei, the former minister of the Ministry of Finance, this group only accounts for 14% of the employed population. If consumer vouchers are issued through this channel, it is likely to cause further unfairness.
Second, judging from the effect of the final implementation, many coupons were sent to enterprises in shopping malls, such as Beijing, and were sent to Starbucks and Haidilao in big shopping malls. But what really needs coupons most may be the small shops on the street, that is, the small shops where you buy steamed buns or take-away riders to have dinner, but they just didn’t get them.
After talking about my worries about coupons, economics often says "on the one hand, on the other hand", and now we will say "on the other hand". Although it may have problems, it must be understood that there is no comprehensive policy at present. If you don’t issue coupons, what should you do? Is it a policy of subsidizing enterprises? There may also be very serious unfairness. There are also unfair phenomena here, and there may even be the problem of "zombie" enterprises with overcapacity.
6. At the enterprise level, it is suggested that both long-term and short-term goals should be taken into account. In the short term, it is undoubtedly necessary to survive. The epidemic has occurred for more than three years, and all enterprises are actively adjusting to it. It is inconvenient to eat offline, so there are more and more prefabricated dishes and home cooking services. It is not easy to travel out of the province now. Taking Beijing as an example, there are more and more boutique short-distance tours around Beijing.
In the future, when planning, enterprises, including schools, should take into account that the COVID-19 epidemic will definitely not be the last public health crisis. When planning, they should take a more long-term view, including whether there should be a better fresh air system when building schools and factories, whether there should be isolated spaces that can be transformed at critical moments, and whether there are compartments that can accommodate single people in dormitory dining areas.
Finally, let’s talk about a long-term thing: "We should be observant when we have good looks". Winter will eventually pass, and enterprises still have to practice hard. Although it is said that consumption is not very good now, there is another reality. Consumers in China are still buying a lot of foreign goods.
Liu He, Vice Premier of the People’s Republic of China published an article on November 4th, "Integrating the strategy of expanding domestic demand with deepening structural reform on the supply side", which mentioned that the problem of "whether there is" in most fields has been basically solved, and the main problem is whether it is good or not. To solve this problem, we need to solve the main contradictions in our society through high-quality development. He gave a judgment that economic development ultimately depends on supply, and it is a good supply. In the long run, supply creates demand, and real quality products can create demand. At the same time, the article also points out several areas that are in demand, but have not been effectively met, including high-quality brand goods, parenting, healthy culture, R&D design, green ecology and so on.
E-commerce data can also show us some new trends. According to JD.COM data, from 2017 to 2021, the most obvious increase in consumption is spiritual consumption, healthy consumption, green consumption, intelligent consumption and service consumption. Another data is that among the top ten brands in terms of turnover, the proportion of domestic products in China has steadily increased from 60% in 2017 to 90% in 2021, which are very positive signals. Compared with other developed countries, China’s consumption ratio is still far lower than other developed countries, which shows that China’s consumption potential is huge in the long run, and China’s big market is an advantage that other countries can hardly have. At the same time, from the data of JD.COM, we can see that the pace of China consumers in the pursuit of high quality has never stopped, and China enterprises have great potential in this respect.