The year 2023 is the first year to fully implement the spirit of the 20th National Congress of the Communist Party of China, and it is also a year of economic recovery and development after three years of epidemic prevention and control in COVID-19. The whole province adheres to the guidance of Socialism with Chinese characteristics Thought of the Supreme Leader in the New Era, thoroughly implements the spirit of the 20th National Congress of the Communist Party of China and the Second Plenary Session of the 20th Central Committee, conscientiously implements the decision-making arrangements of the CPC Central Committee and the State Council, anchors the beautiful blueprint of "three highs and four innovations", focuses on the primary task of high-quality development, deeply promotes "seeking to promote", and makes every effort to fight the "six battles of development". Throughout the year, the economy has made steady progress, improved quality in progress, made new progress in high-quality development, and strived to write Chinese modernization.
I. Synthesis
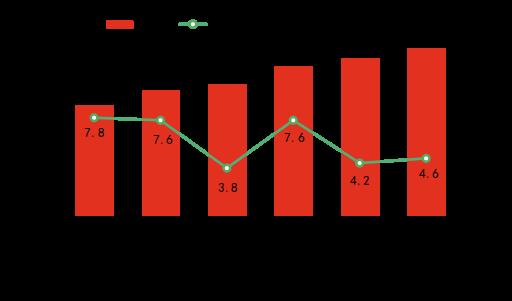
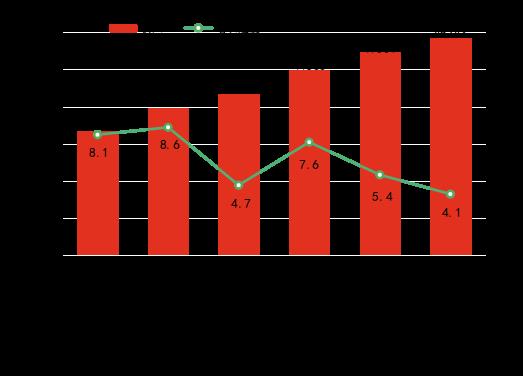
According to the unified accounting results of regional GDP, the annual regional GDP[2] 5001.29 billion yuan, up 4.6% over the previous year. Among them, the added value of the primary industry was 462.13 billion yuan, an increase of 3.5%; The added value of the secondary industry was 1,882.28 billion yuan, an increase of 4.6%; The added value of the tertiary industry was 2,656.88 billion yuan, an increase of 4.8%. The per capita GDP was 75,938 yuan, an increase of 5.0%.
The tertiary industrial structure is 9.3: 37.6: 53.1. The industrial added value increased by 4.8% over the previous year, accounting for 29.1% of the regional GDP; The added value of high-tech industries increased by 8.9%, accounting for 22.8% of the regional GDP. The contribution rates of the added value of the primary, secondary and tertiary industries to economic growth are 7.8%, 38.1% and 54.1% respectively. Among them, the contribution rate of industry to economic growth is 31.2%, and the contribution rate of producer services to economic growth is 25.7%.
Regionally, Changsha-Zhuzhou-Xiangtan area[3]The GDP was 2,074.17 billion yuan, an increase of 4.9% over the previous year; The GDP of southern Hunan was 979.73 billion yuan, up by 4.9%. The GDP of western Hunan was 811.02 billion yuan, an increase of 4.8%. The GDP of Dongting Lake area was 1,136.37 billion yuan, up by 4.0%.
Second, agriculture
The total output value of agriculture, forestry, animal husbandry and fishery was 819.94 billion yuan, an increase of 3.7% over the previous year. The grain planting area was 4,763.5 thousand hectares, a decrease of 2.0 thousand hectares. Among them, the area of summer grain is 113.3 thousand hectares, an increase of 0.7 thousand hectares or 0.6%; The area of early rice was 1,204.8 thousand hectares, a decrease of 8.0 thousand hectares or 0.7%; The area of autumn grain was 3,445.4 thousand hectares, an increase of 5.3 thousand hectares or 0.2%. Among the autumn grain areas, the area of middle rice and late rice in one season is 1481.7 thousand hectares, a decrease of 0.17 thousand hectares; The area of double-cropping late rice was 1260.5 thousand hectares, a decrease of 12.5 thousand hectares or 1.0%. The annual grain output was 30.68 million tons, an increase of 500,000 tons and an increase of 1.7%. Among them, the output of summer grain was 462,000 tons, an increase of 5,000 tons and an increase of 1.2%; The output of early rice was 7.432 million tons, an increase of 19,000 tons and an increase of 0.3%. The output of autumn grain was 22.787 million tons, an increase of 476,000 tons and an increase of 2.1%.

The annual cotton planting area was 55.9 thousand hectares, down 13.5% from the previous year; The planting area of sugar was 7.5 thousand hectares, down by 0.2%; The oil planting area was 1614.8 thousand hectares, an increase of 6.4%. The cotton output was 76,000 tons, a decrease of 7.6%; 2.931 million tons of oil, an increase of 5.8%; 217,000 tons of flue-cured tobacco, an increase of 11.3%; 276,000 tons of tea, an increase of 3.9%.
The total output of pigs, cattle, sheep and poultry was 5.797 million tons, an increase of 0.4% over the previous year. Among them, the pork output was 4.618 million tons, an increase of 0.9%; The beef output was 204,000 tons, down by 5.6%; The output of mutton was 169,000 tons, down by 7.1%; The output of poultry meat was 806,000 tons, up by 1.3%. At the end of the year, the number of live pigs was 38.613 million, down 6.2% from the end of last year, among which the number of fertile sows was 3.501 million, down 5.3%; The cattle population was 4.107 million, down by 7.0%; There are 7.528 million sheep on hand, down by 6.1%; There were 368.656 million poultry in cages, an increase of 1.5%. In the whole year, 62.863 million pigs were slaughtered, an increase of 0.6% over the previous year; Cattle slaughtered 1.714 million heads, down 6.4%; 10.182 million sheep were slaughtered, down by 7.6%; 558.578 million poultry were released, an increase of 1.2%. The output of poultry eggs was 1.196 million tons, an increase of 1.8%. The milk output was 78,000 tons, an increase of 8.3%; The output of aquatic products was 2.859 million tons, up by 4.9%.
3.45 million mu of high-standard farmland was built throughout the year. Among them, 1.75 million mu was newly built and 1.7 million mu was upgraded. 2362 water conservancy construction projects were started, with an investment of 63.51 billion yuan, and 260 million cubic meters of earth and stone were completed. Upgrade and transform 5790 kilometers of rural tourist roads, resource roads and industrial roads. At the end of the year, the total power of agricultural machinery was 68.402 million kilowatts, an increase of 0.9% over the end of the previous year.
III. Industry and Construction Industry
The added value of industrial enterprises above designated size increased by 5.1% over the previous year. Among them, the added value of private enterprises increased by 5.2%, accounting for 64.4% of industries above designated size. High-tech manufacturing[4]The added value increased by 3.7%, accounting for 13.5% of industries above designated size. equipment manufacturing industry[5]The added value increased by 8.9%, accounting for 31.5% of industries above designated size. The industrial added value of provincial and above industrial parks increased by 9.0%, accounting for 71.2% of industries above designated size. The added value of the six high energy-consuming industries increased by 7.2%, accounting for 31.3% of the industries above designated size. Regionally, the added value of industrial enterprises above designated size increased by 7.1% in Changsha, Zhuzhou and Xiangtan, 7.1% in southern Hunan, 5.7% in western Hunan and 4.4% in Dongting Lake.
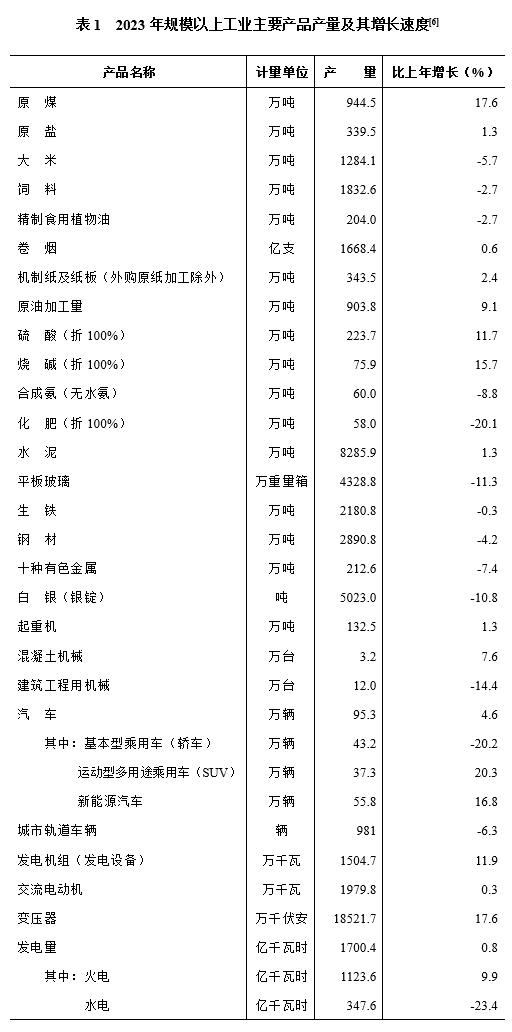
Among the main products of industrial statistics above designated size in the whole year, rice was 12.841 million tons, down 5.7% from the previous year; Feed was 18.326 million tons, down 2.7%; The processing volume of crude oil was 9.038 million tons, an increase of 9.1%; 82.859 million tons of cement, up by 1.3%; 28.908 million tons of steel, down 4.2%; Ten kinds of non-ferrous metals were 2.126 million tons, down by 7.4%; 32,000 concrete machinery, an increase of 7.6%; 953,000 cars, an increase of 4.6%; The power generation was 170.04 billion kWh, an increase of 0.8%.
Total profits of industrial enterprises above designated size[7]205.21 billion yuan, up 4.8% over the previous year. In terms of economic types, state-owned enterprises reached 18.84 billion yuan, an increase of 40.1%; 270 million yuan for collective enterprises, down 32.4%; Joint-stock cooperative enterprises reached 0.1 billion yuan, down 63.6%; Joint-stock enterprises reached 165.43 billion yuan, up by 2.7%; Foreign investors and Hong Kong, Macao and Taiwan businessmen invested 14.87 billion yuan, down 4.2%; Other enterprises reached 5.80 billion yuan, an increase of 6.8%. Among the top five industries with total profits, the manufacturing of chemical raw materials and chemical products was 16.96 billion yuan, down by 7.6%; Computer, communication and other electronic equipment manufacturing industry was 16.15 billion yuan, down by 10.2%; Tobacco products industry was 15.64 billion yuan, up by 18.4%; Non-metallic mineral products industry was 15.10 billion yuan, down by 1.6%; Electrical machinery and equipment manufacturing industry reached 11.69 billion yuan, up by 5.6%. The cost per 100 yuan of operating income of industrial enterprises above designated size is 82.16 yuan, and the profit rate of operating income is 5.22%. At the end of the year, the asset-liability ratio of industrial enterprises above designated size was 52.7%.
The added value of the construction industry in the whole year was 427.71 billion yuan, an increase of 4.5% over the previous year. The total profit of general contracting and professional contracting construction enterprises with above qualifications was 37.60 billion yuan, an increase of 7.5%. The building construction area was 751.223 million square meters, down by 1.4%. The completed building area was 254.596 million square meters, an increase of 6.1%.
Fourth, the service industry
The added value of wholesale and retail industry in the whole year was 512.66 billion yuan, up by 6.1% over the previous year. The added value of transportation, warehousing and postal services was 198.43 billion yuan, an increase of 8.7%; The added value of accommodation and catering industry was 109.80 billion yuan, an increase of 11.5%; The added value of the financial industry was 259.82 billion yuan, an increase of 4.8%; The added value of the real estate industry was 287.69 billion yuan, down by 1.9%; The added value of information transmission, software and information technology services was 131.86 billion yuan, an increase of 10.8%; The added value of leasing and business services was 170.50 billion yuan, up by 6.5%. The operating income of service enterprises above designated size increased by 9.4% and the total profit increased by 41.3%.
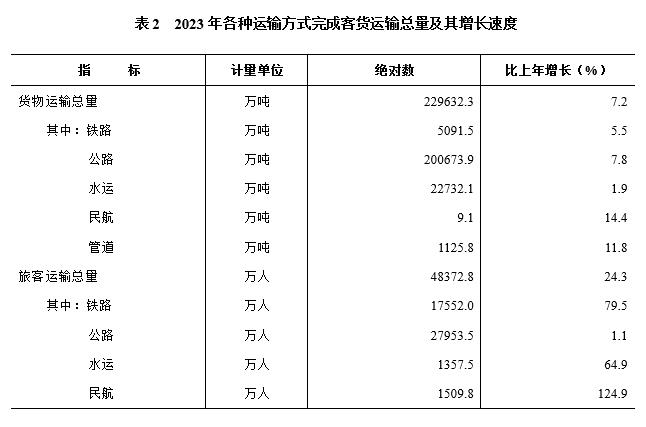
The annual turnover of passenger and cargo transportation was 405.84 billion tons kilometers, an increase of 15.6% over the previous year. The turnover of cargo transportation was 305.75 billion tons kilometers, up by 3.6%. Among them, the railway turnover was 101.54 billion tons kilometers, which was the same as that of the previous year; The highway turnover was 157.44 billion tons kilometers, up by 7.5%. Passenger transport turnover was 134.56 billion person-kilometers, an increase of 72.3%. Among them, the railway turnover was 96.78 billion person-kilometers, up by 79.6%; The highway turnover was 17.25 billion person-kilometers, an increase of 17.7%; The turnover of civil aviation was 20.33 billion person-kilometers, an increase of 116.5%.
At the end of the year, the mileage of highways was 243,000 kilometers, an increase of 0.2% over the end of last year. Among them, the expressway mileage was 7530 kilometers, an increase of 200 kilometers. The operating mileage of the railway is 6078.6 kilometers, which is the same as that of the previous year. Among them, the high-speed railway is 2501 kilometers. The number of civilian vehicles was 11.573 million, an increase of 4.6%. Among them, the number of private cars was 10.776 million, an increase of 4.5%. The number of civilian cars was 6.454 million, an increase of 5.8%.
Total business volume of postal industry in the whole year[8]40.27 billion standard quantity, an increase of 22.7% over the previous year; Total telecom service[9]72.13 billion yuan, up 22.5%. At the end of the year, there were 5.487 million fixed-line users, the same as the previous year; There were 76.803 million mobile phone users, an increase of 7.0%. By the end of the year, there were 27.441 million Internet broadband users, an increase of 10.9%.
The number of domestic tourists was 660 million, an increase of 51.1% over the previous year; The number of inbound tourists was 1.121 million, an increase of 13.5 times. The total tourism revenue was 956.52 billion yuan, an increase of 47.4%. Among them, domestic tourism revenue was 954.51 billion yuan, an increase of 47.2%; The income from inbound tourism was $290 million, an increase of 11.8 times.
V. Investment in fixed assets
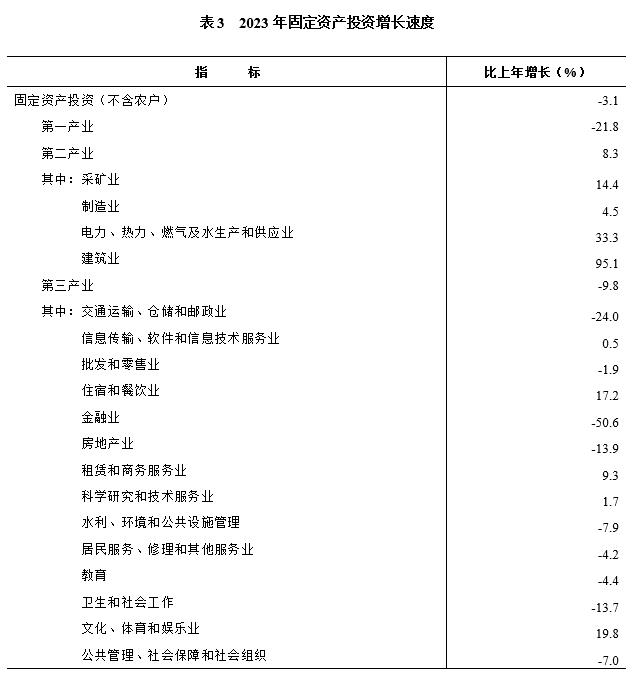
Annual investment in fixed assets (excluding farmers) decreased by 3.1% compared with the previous year. Among them, private investment increased by 0.8%. In terms of economic types, state-owned investment decreased by 7.3% and non-state-owned investment decreased by 1.9%. In terms of investment direction, investment in people’s livelihood projects decreased by 4.5%, investment in ecological environment decreased by 8.6%, investment in infrastructure decreased by 16.1%, and investment in high-tech industries decreased.[10]It increased by 4.0%, and the investment in industrial technological transformation decreased by 4.8%. Regionally, the investment in Changsha, Zhuzhou and Xiangtan decreased by 4.3%, that in southern Hunan increased by 3.5%, that in western Hunan increased by 1.2%, and that in Dongting Lake decreased by 6.1%.
The annual investment in real estate development was 383.31 billion yuan, down 13.1% from the previous year. Among them, residential investment was 311.82 billion yuan, down 9.1%. The sales area of commercial housing was 56.365 million square meters, down by 14.1%. Among them, the residential sales area was 50.975 million square meters, down 13.8%. The sales of commercial housing was 370.01 billion yuan, down by 11.6%. Among them, residential sales reached 329.97 billion yuan, down 11.1%. At the end of the year, the area of commercial housing for sale was 12.967 million square meters, an increase of 754,000 square meters or 6.2% over the end of the previous year.
VI. Domestic Trade and Prices
The total retail sales of social consumer goods in 2020.33 billion yuan, an increase of 6.1% over the previous year. In terms of business locations, the retail sales of urban consumer goods was 1,744.56 billion yuan, an increase of 5.9%; The retail sales of rural consumer goods reached 275.77 billion yuan, an increase of 6.7%. In terms of consumption types, the retail sales of commodities was 1,762.78 billion yuan, an increase of 5.2%; The catering revenue was 257.55 billion yuan, an increase of 12.3%. In terms of regions, the total retail sales of social consumer goods in Changsha, Zhuzhou and Xiangtan reached 780.85 billion yuan, an increase of 5.5%; The total retail sales of social consumer goods in southern Hunan was 403.70 billion yuan, an increase of 4.4%; The total retail sales of social consumer goods in western Hunan was 364.33 billion yuan, an increase of 7.0%; The total retail sales of social consumer goods in Dongting Lake area was 471.46 billion yuan, an increase of 7.8%.
Among the retail sales of commodities above designated size, the retail sales of grain, oil and food increased by 12.2%, tobacco and alcohol increased by 7.2%, household appliances and audio-visual equipment increased by 6.8%, Chinese and western medicines increased by 5.6%, communication equipment increased by 7.4%, petroleum and products increased by 12.6%, and automobiles decreased by 2.4%. Among green smart goods, the retail sales of wearable smart devices increased by 12.8%, smartphones increased by 13.7%, and new energy vehicles increased by 40.8%.
The annual online retail sales of physical goods reached 243.20 billion yuan, up by 12.1% over the previous year, accounting for 12.0% of the total retail sales of social consumer goods.
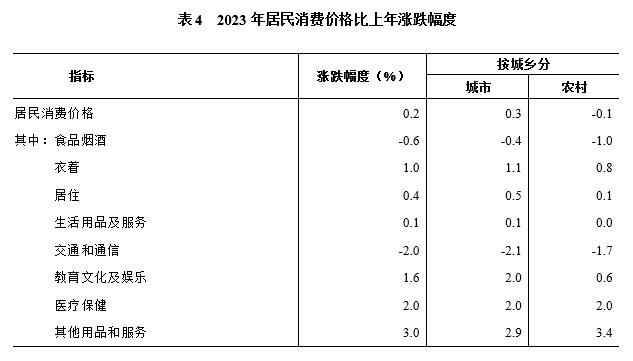
Consumer prices in the province rose by 0.2% over the previous year. Among them, cities rose by 0.3% and rural areas fell by 0.1%. The ex-factory price of industrial producers decreased by 1.5%, and the purchase price of industrial producers decreased by 2.5%. Producer prices of agricultural products fell by 2.4%.
VII. Foreign Economy
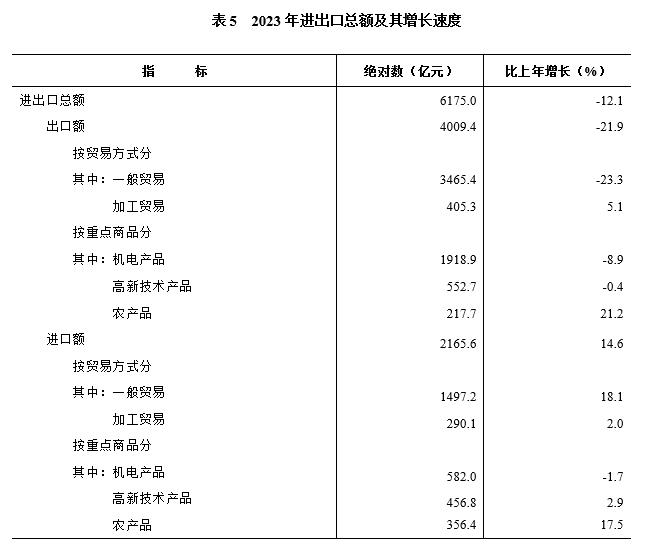
Total annual import and export volume[11]617.50 billion yuan, down 12.1% from the previous year. Among them, exports were 400.94 billion yuan, down by 21.9%; Imports reached 216.56 billion yuan, up by 14.6%. In terms of trade mode, the general trade export was 346.54 billion yuan, down by 23.3%; The export of processing trade was 40.53 billion yuan, up by 5.1%. Among the key export commodities, mechanical and electrical products were 191.89 billion yuan, down 8.9%; High-tech products reached 55.27 billion yuan, down 0.4%. In terms of production and sales countries (regions), the export to the United States was 44.97 billion yuan, down 37.9%; Exports to Hong Kong, China reached 53.68 billion yuan, up by 3.1%; Export to EU[12]35.55 billion yuan, down 29.4%; Exports to ASEAN reached 76.18 billion yuan, down 34.2%; The number of countries exporting the Belt and Road Initiative was 218.18 billion yuan, down by 18.7%.
The actual use of foreign direct investment in the whole year was US$ 1.44 billion, down 59.3% from the previous year. Among them, the primary industry was US$ 0.2 billion, up by 5.2%; The secondary industry was $570 million, an increase of 43%; The tertiary industry was $850 million, down 72.8%. 274 projects of Fortune 500 enterprises were newly introduced. In fact, the domestic and foreign funds in place were 1,506.23 billion yuan, an increase of 16.5%. Among them, the primary industry was 66.22 billion yuan, down 2.0%; The secondary industry was 900.10 billion yuan, an increase of 29.3%; The tertiary industry was 539.92 billion yuan, an increase of 2.0%. 1879 major projects were introduced.
In the whole year, the amount of newly signed contracts for foreign contracted projects was 2.99 billion US dollars, and the turnover was 2.35 billion US dollars. Sent 7,000 laborers of various types. Foreign direct investment increased by 2.01 billion US dollars, down by 25.2%. The actual amount of foreign direct investment was US$ 2.22 billion, up by 16.3%.
VIII. Finance and finance
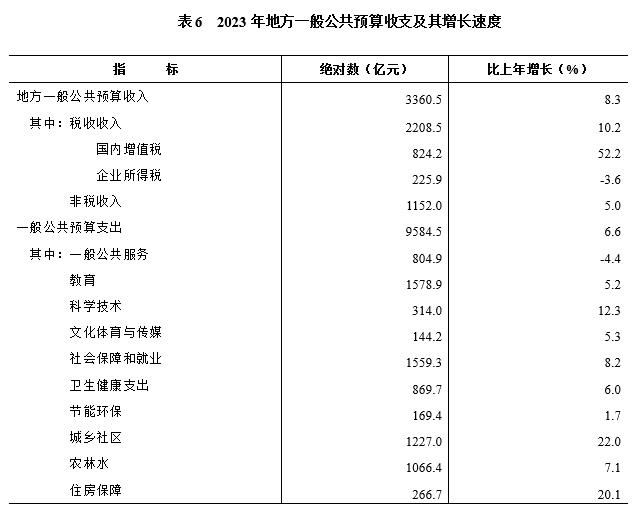
The local general public budget revenue for the whole year was 336.05 billion yuan, an increase of 8.3% over the previous year. Among them, tax revenue was 220.85 billion yuan, an increase of 10.2%; Non-tax revenue was 115.20 billion yuan, up by 5.0%. Among tax revenue, domestic value-added tax was 82.42 billion yuan, up by 52.2%; Enterprise income tax was 22.59 billion yuan, down 3.6%. The general public budget expenditure was 958.45 billion yuan, an increase of 6.6%. Among them, education expenditure was 157.89 billion yuan, an increase of 5.2%; Expenditure on social security and employment was 155.93 billion yuan, an increase of 8.2%; Health expenditure was 86.97 billion yuan, an increase of 6.0%; Expenditure on science and technology was 31.40 billion yuan, an increase of 12.3%; Expenditure on housing security was 26.67 billion yuan, an increase of 20.1%.
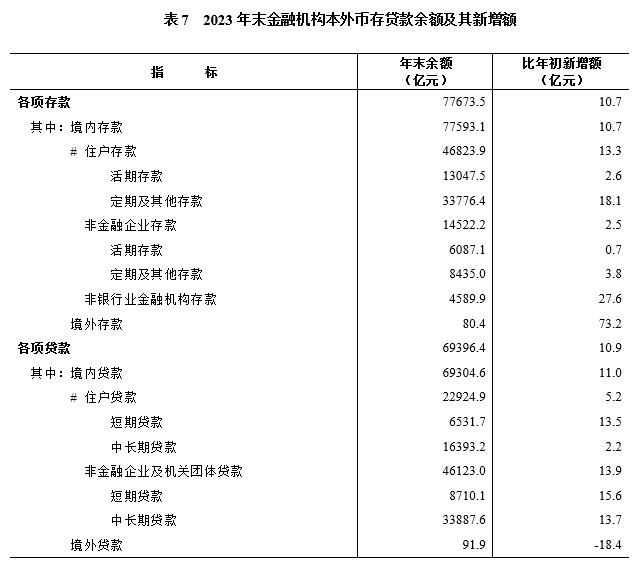
At the end of the year, the balance of local and foreign currency deposits of financial institutions was 7,767.35 billion yuan, an increase of 10.7% over the end of the previous year. Among them, the balance of household deposits was 4,682.39 billion yuan, an increase of 13.3%; The balance of deposits of non-financial enterprises was 1,452.22 billion yuan, up by 2.5%. The balance of local and foreign currency loans was 6,939.64 billion yuan, up by 10.9%. Among them, the balance of household loans was 2,292.49 billion yuan, an increase of 5.2%; The loan balance of non-financial enterprises and government organizations was 4,612.30 billion yuan, an increase of 13.9%.
At the end of the year, there were 146 listed companies in the province, with a total direct financing of 404.59 billion yuan, an increase of 10.0% over the previous year. At the end of the year, the total market value of A-share listed companies was 1,522.05 billion yuan, down 6.3%. At the end of the year, there were 430 branches (including branches and business departments) of securities companies, a decrease of 4; The annual securities transaction volume was 11,833.71 billion yuan, down by 1.2%. At the end of the year, there were 2 futures companies in the jurisdiction, which was the same as the previous year; The annual turnover was 4,937.03 billion yuan, down by 11.4%.
In the whole year, the original insurance premium income of insurance companies was 169.40 billion yuan, an increase of 5.0% over the previous year. Among them, life insurance premium income was 87.65 billion yuan, an increase of 7.2%; Health insurance premium income was 31.83 billion yuan, down 3.1%; Personal accident insurance premium income was 3.38 billion yuan, down 9.5%; Property insurance premium income was 46.54 billion yuan, an increase of 8.2%. The original insurance payment expenditure was 68.43 billion yuan, an increase of 17.8%.
IX. Education, Science and Technology
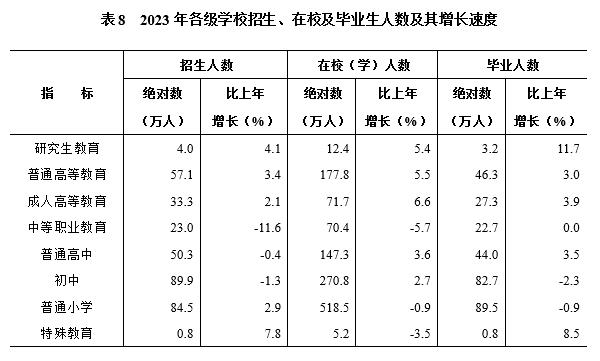
At the end of the year, there were 123 colleges and universities. There are 32,000 graduates of postgraduate education, 463,000 graduates of ordinary higher education, 227,000 graduates of secondary vocational education, 440,000 graduates of ordinary high schools, 827,000 graduates of junior high schools and 895,000 graduates of ordinary primary schools. There were 1.837 million children in the park, down 15.0% from the previous year. Enrolment rate of primary school-age children[13]100%, the gross enrollment rate of high school education[14] 94.77%。 There are 9932 private schools of all kinds, with 2.169 million students. 1.45 billion yuan of national scholarships and grants were granted to college students, and 769,000 college students were assisted. 520 million yuan of state grants for secondary vocational schools were granted, and 522,000 secondary vocational students were assisted. 11.34 billion yuan was secured for compulsory education, and 560 million yuan was granted to ordinary senior high schools.
At the end of the year, there were 12 national engineering research centers (engineering laboratories) and 399 provincial engineering research centers (engineering laboratories). There are 42 national and local joint engineering research centers (engineering laboratories). There are 75 enterprise technology centers recognized by the state. There are 14 national engineering technology research centers and 811 provincial engineering technology research centers. There are 28 national (national) key laboratories and 387 provincial key laboratories. 55,295 technical contracts were signed, with a turnover of 399.53 billion yuan. 910 scientific and technological achievements were registered. The number of patents granted was 74,940, down by 19.4%. Among them, the number of invention patents granted was 20,133, down by 1.4%. The number of patents granted by industrial and mining enterprises, universities and scientific research units is 51,332, 9,153 and 673 respectively.

At the end of the year, there were 2051 inspection and testing institutions. Among them, there are 25 national product quality supervision and inspection centers. There are 104 legal metrological verification institutions. There are 1953 production units of special equipment and 571,000 sets of special equipment. The qualified rate of supervision and spot check of key industrial products is 87.9%. Participated in the formulation of 3 international standards, 247 national standards and 406 local standards. 2,197 maps were published publicly, with 857,000 map users visiting, and 217,000 geospatial data were provided.
X. Culture, Health and Sports
By the end of the year, there were 655 performing arts groups, 149 mass art museums and cultural centers, 148 public libraries and 180 museums and memorial halls. There are 108 radio and television stations (broadcasters). There are 5.853 million cable TV users. The comprehensive population coverage rate of broadcasting is 99.43%, and that of television is 99.77%. There are 137 national intangible cultural heritage protection catalogues and 410 provincial intangible cultural heritage protection catalogues. 12,078 books, 235 periodicals and 44 newspapers were published, and the total print runs of books, periodicals and newspapers were 590 million, 80 million and 500 million respectively.
At the end of the year, there were 57,518 health institutions. Among them, there are 1,784 hospitals, 139 maternal and child health centers (stations), 67 specialized disease prevention hospitals (stations), 2,070 township health centers, 1,051 community health service centers (stations), 14,036 clinics, health centers and medical offices, and 36,130 village clinics. There were 569,000 health technicians, an increase of 9.7% over the previous year. Among them, there are 219,000 practicing doctors and assistant practicing doctors and 270,000 registered nurses. The hospital has 390,000 beds, down by 1.9%; Township hospitals have 105,000 beds, down by 3.5%.
The province carried out 3337 national fitness projects. There are 430 new administrative villages for farmers’ physical fitness projects. Won 61 national championships throughout the year. There are 194,745 sports venues. Among them, there are 316 gymnasiums, 7,507 sports grounds, 1,546 swimming pools and 8,248 training rooms.
XI. Population, Residents’ Income, Consumption and Social Security
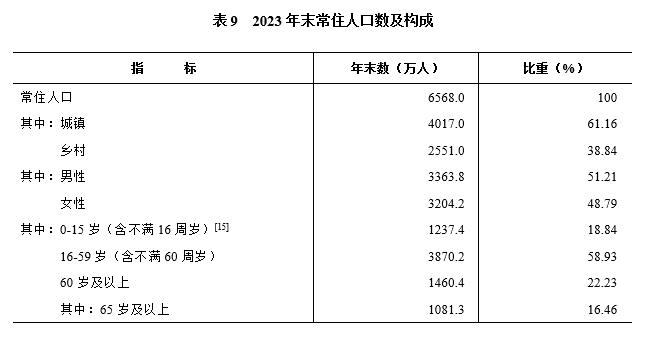
At the end of the year, the resident population of the province was 65.68 million. Among them, the urban population was 40.17 million, and the urbanization rate was 61.16%, an increase of 0.85 percentage points over the end of last year. The annual birth population was 395,000, with a birth rate of 6.00 ‰; The death population was 598,000, with a mortality rate of 9.08 ‰; The natural population growth rate is -3.08‰. The proportion of the population aged 0-15 (including those under 16) to the resident population was 18.84%, down by 0.68 percentage points; The proportion of people aged 16-59 (including those under 60) was 58.93%, down by 0.72 percentage points; The proportion of people aged 60 and over was 22.23%, an increase of 1.39 percentage points.
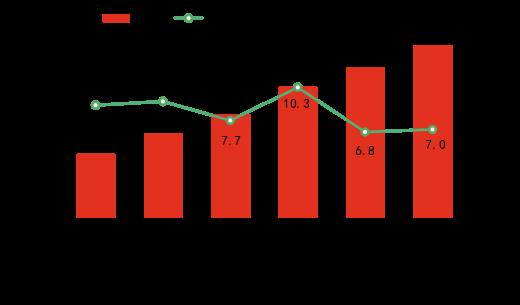
In the whole year, the per capita disposable income of residents in the province was 35,895 yuan, an increase of 5.5% over the previous year; The median per capita disposable income of residents was 28,606 yuan, an increase of 4.4%. According to the place of permanent residence, the per capita disposable income of urban residents was 49,243 yuan, an increase of 4.1%; The median per capita disposable income of urban residents was 43,705 yuan, an increase of 3.0%. The per capita disposable income of rural residents was 20,921 yuan, an increase of 7.0%; The median per capita disposable income of rural residents was 18,585 yuan, an increase of 5.7%. The income ratio of urban and rural residents decreased from 2.42 in the previous year to 2.35. In terms of regions, the per capita disposable income of all residents in Changsha, Zhuzhou and Xiangtan is 54,069 yuan, an increase of 4.4%; The per capita disposable income of all residents in southern Hunan was 33,228 yuan, an increase of 5.5%; The per capita disposable income of all residents in western Hunan is 25,110 yuan, an increase of 6.3%; The per capita disposable income of all residents in Dongting Lake area was 32,744 yuan, an increase of 5.4%. Poverty alleviation county[16]The per capita disposable income of rural residents was 16,036 yuan, an increase of 9.0%.
The per capita consumption expenditure of residents in the province was 25,462 yuan, an increase of 5.7% over the previous year. According to the place of permanent residence, the per capita consumption expenditure of urban residents was 31,035 yuan, an increase of 4.9%; The per capita consumption expenditure of rural residents was 19,210 yuan, an increase of 6.3%.
In the whole year, 765,000 people were newly employed in cities and towns. At the end of the year, 34.13 million people participated in the basic old-age insurance for urban and rural residents. The number of people participating in the basic old-age insurance for urban workers was 20.184 million, an increase of 6.6%. Among them, there are 14.54 million employees and 5.644 million retirees. The number of people participating in the basic medical insurance for urban and rural residents was 53.09 million, and the number of people participating in the basic medical insurance for urban workers was 10.467 million. The number of people participating in unemployment insurance was 7.404 million, an increase of 2.3%. The number of employees participating in industrial injury insurance was 9.945 million. The number of employees participating in maternity insurance was 7.035 million. At the end of the year, the number of employees receiving unemployment insurance was 184,000.
323,000 urban residents received the government’s minimum living guarantee, and 1.71 billion yuan of minimum living guarantee funds were distributed; 1.471 million rural residents received the government’s minimum living security, and 4.76 billion yuan of minimum living security funds were distributed. At the end of the year, 244,000 beds were provided for residential civil administration institutions, and 114,000 people were adopted. Among them, there are 230,000 beds in the old-age care institutions and 108,000 people in the old-age care institutions. There are 32,000 community service institutions and facilities. In the whole year, 8.03 billion yuan of social welfare lottery tickets were sold, and 2.45 billion yuan of welfare lottery funds were raised. Successfully completed 20 projects of ten key livelihood issues. Among them, the renovation of 2,000 old urban communities was started, with an additional water storage capacity of 50.894 million cubic meters, and 1.031 million women of rural school age and urban low-income women were examined for "two cancers" free of charge.
XII. Resources, Environment and Safety in Production
157 kinds of minerals have been discovered and 124 kinds of minerals have been proved in the province. Among them, there are 7 kinds of energy minerals, 39 kinds of metal minerals, 76 kinds of non-metal minerals and 2 kinds of water and gas minerals. 21 geological exploration projects (including continuation projects) (including provincial financial investment projects only) were funded by the government, and 2 large and medium-sized mineral areas were newly discovered.
In the whole year, the proportion of water quality sections meeting or better than Class III standards was 97.2%, down 0.2 percentage points from the previous year. The proportion of days with good air quality is 90.5%. There are 53 nature reserves at or above the provincial level, covering an area of 906,000 hectares. Among them, 23 are national and 30 are provincial. There are 2 world geoparks and 14 national geoparks. The afforestation area was 441,000 hectares.
The comprehensive energy consumption of industrial enterprises above designated size decreased by 0.7% over the previous year. Among them, the comprehensive energy consumption of six high-energy-consuming industries increased by 1.4%.
In the whole year, there were 1244 production and operation safety accidents, and 1318 people died. 0.03 people died in accidents with a GDP of 100 million yuan. The number of deaths per 10,000 vehicles in road traffic accidents was 2.22, a decrease of 0.37 over the previous year.
Notes:
[1] The data in this bulletin are all preliminary statistics, and some data are not equal to the total of sub-items due to rounding.
[2] The absolute figures of regional GDP, added value of tertiary industries and related industries and per capita regional GDP are calculated at current prices, and the growth rate is calculated at constant prices.
[3] Changsha-Zhuzhou-Xiangtan region refers to Changsha, Zhuzhou and Xiangtan, southern Hunan refers to Hengyang, Chenzhou and Yongzhou, western Hunan refers to Shaoyang, Zhangjiajie, Huaihua, Loudi and Xiangxi Autonomous Prefecture, and Dongting Lake refers to Yueyang, Changde and Yiyang.
[4] High-tech manufacturing includes pharmaceutical manufacturing, aviation, spacecraft and equipment manufacturing, electronic and communication equipment manufacturing, computer and office equipment manufacturing, medical equipment and instrumentation manufacturing, and information chemicals manufacturing.
[5] Equipment manufacturing industry includes metal products industry, general equipment manufacturing industry, special equipment manufacturing industry, automobile manufacturing industry, railway, ship, aerospace and other transportation equipment manufacturing industry, electrical machinery and equipment manufacturing industry, computer, communication and other electronic equipment manufacturing industry, and instrument manufacturing industry.
[6] The output data of some products in 2022 were verified and adjusted, and the output growth rate in 2023 was calculated according to comparable caliber.
[7] Due to the changes in the scope of investigation stipulated in the statistical investigation system, statistical law enforcement, elimination of duplicate data and other factors, the growth rate and changes of financial indicators of industrial enterprises above designated size in 2023 are calculated according to comparable caliber.
[8] The total business volume of the postal industry is calculated at constant prices in 2020.
[9] The total telecom business is calculated at the constant price of last year.
[10] High-tech industry investment includes six categories of high-tech manufacturing investment and information services, e-commerce services, inspection and testing services, high-tech services in professional and technical services, R&D and design services, scientific and technological achievements transformation services, intellectual property rights and related legal services, environmental monitoring and governance services and other high-tech services, including pharmaceutical manufacturing, aviation, spacecraft and equipment manufacturing, electronic and communication equipment manufacturing, computer and office equipment manufacturing, medical equipment and instrumentation manufacturing.
[11] According to relevant regulations, foreign trade is denominated in RMB.
[12] The import and export amount of goods to the EU does not include the data of Britain, and the growth rate is calculated according to the comparable caliber.
[13] The enrollment rate of primary school-age children refers to the percentage of school-age children who have entered primary school within the scope of investigation to the total number of school-age children inside and outside the school.
[14] The gross enrollment rate of high school education mainly reflects the coverage of high school education, which means that the total number of students in high school accounts for the percentage of the school-age population aged 15-17.
[15] By the end of 2023, there were 11.434 million people aged 0-14 (including those under the age of 15) and 39.642 million people aged 15-59 (including those under the age of 60).
[16] Poverty-stricken counties in Hunan Province, that is, the original poverty-stricken areas in Hunan, including the original concentrated contiguous poverty-stricken areas and the original national poverty alleviation and development key counties outside the area, have a total of 40 counties.
Source:
The financial data in this bulletin comes from the Provincial Department of Finance; Railway transportation and mileage data are from China Railway Guangzhou Bureau Group Co., Ltd., China Railway Nanning Bureau Group Co., Ltd., China Railway Nanchang Bureau Group Co., Ltd., China Railway Wuhan Group Co., Ltd. and Shichang Railway Co., Ltd.; The data of highway transportation, waterway transportation and highway mileage come from the Provincial Department of Transportation; The data of civil aviation transportation comes from Provincial Airport Management Group Co., Ltd. and China Southern Airlines Co., Ltd. Hunan Branch; Pipeline transportation data come from Changling Branch of China Petrochemical Co., Ltd., Changling Branch of China Petrochemical Group Asset Management Co., Ltd., Baling Petrochemical Branch of China Petrochemical Group Asset Management Co., Ltd., Hunan Oil Transportation Branch of Huazhong Branch of National Petroleum and Natural Gas Pipeline Network Group Co., Ltd., Changsha Xinao Gas Co., Ltd., Changsha China Resources Gas Co., Ltd., Xiangtan Xinao Gas Co., Ltd., Changde PetroChina Kunlun Gas Co., Ltd., Loudi China Resources Gas Co., Ltd., etc. Car ownership data comes from the provincial public security department; The data of telecom business volume, mobile phone users, fixed phone users and Internet broadband users come from the Provincial Communications Administration. The postal service data comes from the provincial postal administration; Data of deposits and loans come from Hunan Branch of China People’s Bank; The data of listed companies come from the Financial Office of the Provincial Party Committee; Securities and futures data come from Hunan Supervision Bureau of China Securities Regulatory Commission; The data of insurance industry comes from Hunan Supervision Bureau of the State Financial Supervision Administration; Education data comes from the Provincial Department of Education; Science and technology data comes from the Provincial Science and Technology Department;Patent, quality inspection and industry standard data come from the Provincial Market Supervision Administration; Surveying and mapping, mineral resources data from the Provincial Department of Natural Resources; Data on the protection of art performance groups, museums, public libraries, cultural centers and intangible cultural heritage come from the Provincial Department of Culture and Tourism. Radio and television data come from the Provincial Radio and Television Bureau; The data of newspapers, periodicals and books come from the Propaganda Department of the Provincial Party Committee; Health data comes from the Provincial Health and Wellness Committee; Sports data comes from the provincial sports bureau; The data of new employment, social insurance and vocational skills training in cities and towns come from the Provincial Department of Human Resources and Social Security. The data of medical insurance and maternity insurance come from the provincial medical insurance bureau; The data of urban and rural subsistence allowances, social welfare and community services come from the Provincial Civil Affairs Department; The data of water conservancy construction comes from the Provincial Water Resources Department; The data of aquatic product output and high-standard farmland construction come from the Provincial Department of Agriculture and Rural Affairs. Urban construction data comes from the Provincial Department of Housing and Urban-Rural Development; The data of nature reserves, geological parks and afforestation come from the Provincial Forestry Bureau. Surface water quality and air quality data come from the Provincial Department of Ecology and Environment; Safety production data comes from the provincial emergency management department; Other data come from the Provincial Bureau of Statistics and the Hunan Investigation Corps of the National Bureau of Statistics.
关于作者